

CEO Memo - March 2023
March was another big month in the Wonky World. We were blessed to have our Operations Director the Philippines, Grace and her husband Patrick, over for two weeks to meet the NZ team and enjoy Auckland’s sights.
We had a new Insights Project Manager join us in Manila. Krystle has a decade of experience in digital marketing, and has taken to the company like a duck to water. We are very impressed with her maturity and her ability to pick up our internal process.
Our international expansion continues at an amazing pace, with the legal, accounting and insurance all sorted. We have a new virtual office in Houston, as well as local numbers. Most miraculous of all, we have secured the domain webwonks.com; a big milestone for the company.
Featured Walkthrough | March | Using ChatGPT To Create Website Content
Market Insights
Last year we started the process of aggregating client data into anonymised reports that allowed us to provide insights into a slice of the market’s ad spend, and subsequent number of conversions and revenue. This was well received, but we want to keep working on how we better deliver insights to our clients.
One way of doing this is to integrate Google Analytics and Google Cloud to better handle larger queries and insights. To do this, we will need to make additions to your Google Tag Manager account to send data from GA4 to Google Cloud - this process will begin in July.
Overall Metrics:
NB: Due to limitations imposed by Google, the data below is only a sample of 20% of total datasets.
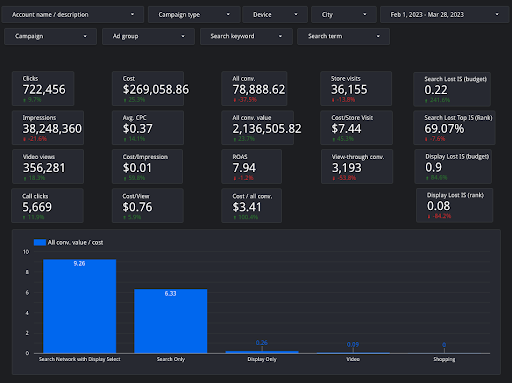
The details below highlight the Google Ads Performance from 1st February 2023 to 28th March 2023.
In comparison to the previous year for the same period, the cost has increased by 25.3%, and the average cost per click has increased by 14.1%. This is similar to the trend we noticed in the previous month.
Overall conversion value (Online Revenue from Ads) has improved by 23.7% and ROAS was at 7.94. This is an improvement on January 2023 data and also in comparison to the 2022 figure for the revenue.
Store visits have dropped by 13.8% Year on Year, and the cost per impression for the ads also increased by 59.8%, which indicates an increase in the cost of displaying the ads across the Google network in comparison to the previous year.
Return On Ad Spend Metrics
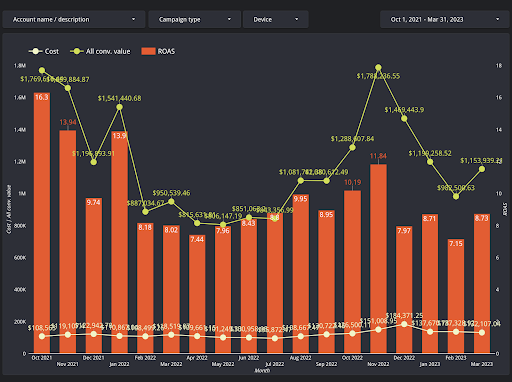
The graph chart below highlights the ROAS trend over the past year.
We noticed an improvement in the ROAS figure in March 2023 (8.73), which is the best for this year so far. March 2023 also performed strongly with an increase in overall e-commerce revenue on the same websites in comparison to February 2023.